Performance & Financial Information
- 1Q
- 2Q
- 3Q
- FY
Net sales(unit: 1 million yen)
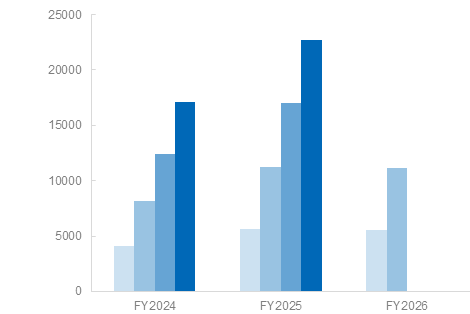
FY2024
FY2025
FY2026
4Q
17,113
22,675
3Q
12,409
16,975
2Q
8,122
11,199
11,116
1Q
4,077
5,614
5,560
Gross profit(unit: 1 million yen)
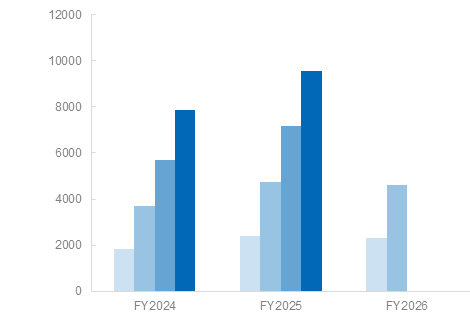
FY2024
FY2025
FY2026
4Q
7,846
9,566
3Q
5,693
7,177
2Q
3,684
4,733
4,633
1Q
1,839
2,386
2,294
Operating profit(unit: 1 million yen)
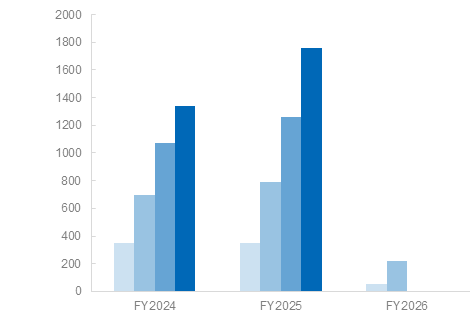
FY2024
FY2025
FY2026
4Q
1,340
1,759
3Q
1,070
1,260
2Q
695
793
218
1Q
346
346
54
Ordinary profit(unit: 1 million yen)
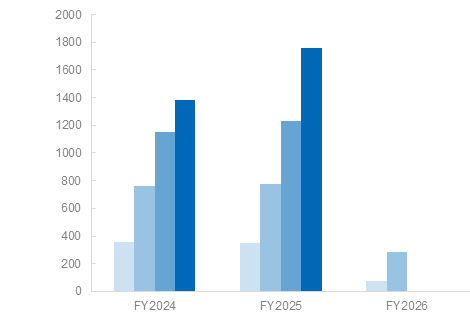
FY2024
FY2025
FY2026
4Q
1,386
1,759
3Q
1,150
1,232
2Q
761
777
285
1Q
356
350
74
Profit attributable to owners of parent(unit: 1 million yen)
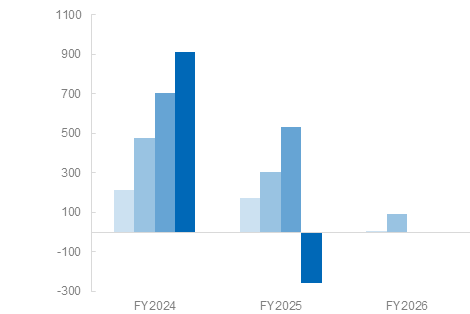
FY2024
FY2025
FY2026
4Q
910
(257)
3Q
705
529
2Q
477
303
89
1Q
213
171
7
Earnings per share(unit: yen)

FY2024
FY2025
FY2026
4Q
58.3
(16.3)
3Q
45.0
33.5
2Q
30.8
19.2
5.68
1Q
13.8
10.9
0.48
- The second quarter(2Q)shows cumulative information from the first quarter to the second quarter.
- The third quarter(3Q)shows cumulative information from the first quarter to the third quarter.
【Precautions for the Usage】
- When the quarterly financial statement amendments are announced, the information on this data will not immediately be updated.
- When stock splits occur, related indexes are not retroactively amended.
- With changes in quarterly financial statement formats, the update frequency may be changed.
The information on this data is created based on quarterly financial statements.
Substantial care has been put into the data conversion for posting on the data. However, information may contain errors from intentional alternation by a third party, mechanical defects due to machine malfunctions, or other force majeure, so please exercise caution.
For details on financial statements, please check the quarterly financial statement materials.